# Azure Kubernetes clusters summary in Grafana
When managing multiple kubernetes clusters / AKS in azure, it is good to know the state / size of all kubernetes clusters in single place like grafana dashboard. In this post, I will be explaining the easiest way to get the state of all the clusters across all of your Azure subscriptions in Grafana.
We are going to use Azure Resource Graph to get the results. To get the azure resource graph results in grafana, I am using Grafana Azure Datasource plugin. You can also use the queries wihtout grafana in Azure dashboard.
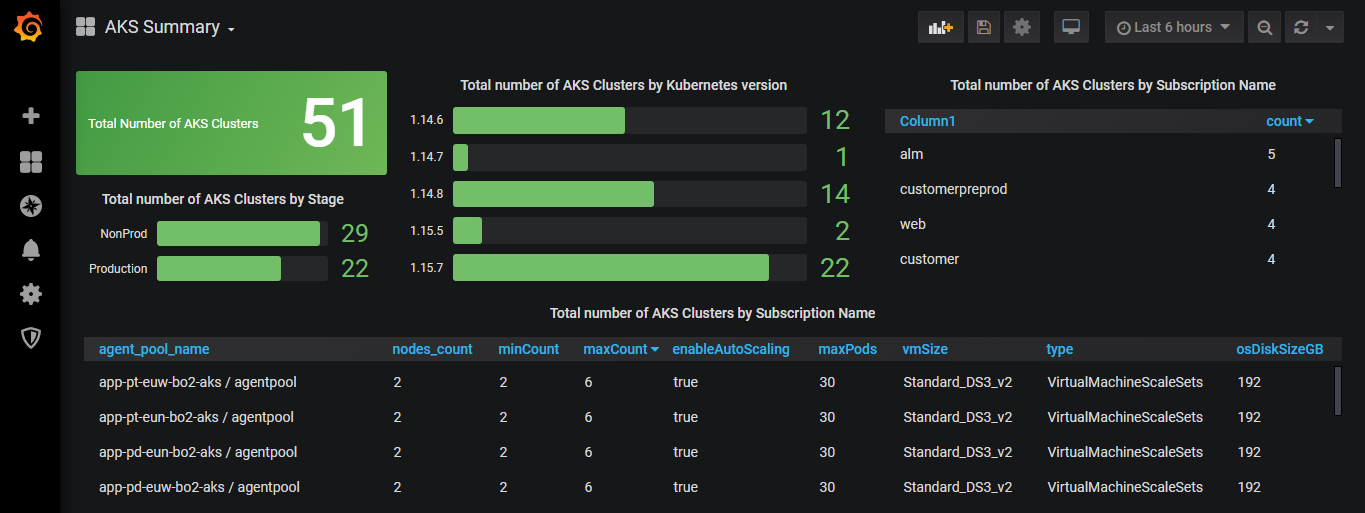
Below is the screenshot of the Grafana dashboard.

# Pre-Requisites
- Reader access to the necessary subscription ( in case of using with Grafana, need a SPN with Reader access to the subscription )
- Grafana 5.2.x or newer
- Grafana Azure Datasource plugin
# Setup
Once installed the Grafana and Grafana azure data source plugin, You need to configure the SPN as the datasource for Grafana. Then like any other grafana dashboard, you can query the Azure Resoruce Graph in grafana.
# Azure Resource Graph queries
Below is the list of azure resource graph queries I am using in the dashboard.
# Total Number of AKS Clusters
resources
| where type contains "microsoft.containerservice/managedclusters"
| count
# Total number of AKS Clusters by Kubernetes version
resources
| where type contains "microsoft.containerservice/managedclusters"
| extend cluster_version = tostring(properties.kubernetesVersion)
| summarize count = count() by cluster_version
| order by cluster_version asc
# Total Number of AKS Clusters by Subscription
ResourceContainers
| where type=="microsoft.resources/subscriptions"
| project SubscriptionName = name, subscriptionId
| join (
        resources
        | where type contains "microsoft.containerservice/managedclusters"
        | summarize number_of_resosurces = count() by subscriptionId
    ) on subscriptionId
| project-away subscriptionId,subscriptionId1
| project SubscriptionName, count = number_of_resosurces
| order by ["count"] desc
# Total number of AKS Clustes grouped by tags
Following query assumes you have either stage or Stage tag in your AKS Clster and trying to summarize the count by that tag value.
resources
| where type contains "microsoft.containerservice/managedclusters"
| extend stage = strcat(tags.stage, tags.Stage)
| extend stage = iff(isempty(stage), 'Unknown', stage)
| summarize count = count() by stage
# Cluster Size information by Agent Pool
resources
| where type contains "microsoft.containerservice/managedclusters"
| mv-expand agentPoolProfile = properties.agentPoolProfiles
| extend agentPoolId = strcat(name," / ", agentPoolProfile.name)
| project
    agent_pool_name = agentPoolId ,
    nodes_count = agentPoolProfile["count"],
    minCount = agentPoolProfile["minCount"],
    maxCount = agentPoolProfile["maxCount"],
    enableAutoScaling = agentPoolProfile["enableAutoScaling"],
    maxPods = agentPoolProfile["maxPods"],
    vmSize = agentPoolProfile["vmSize"],
	poolType = agentPoolProfile["type"],
    osDiskSizeGB = agentPoolProfile["osDiskSizeGB"]
# Total Nodes count
resources
| where type contains "microsoft.containerservice/managedclusters"
| mv-expand agentPoolProfile = properties.agentPoolProfiles
| summarize total_nodes = sum(toint(agentPoolProfile["count"]))
# Total number of agent pools and nodes
resources
| where type contains "microsoft.containerservice/managedclusters"
| mv-expand agentPoolProfile = properties.agentPoolProfiles
| summarize total_agent_pools = count(),
            total_nodes = sum(toint(agentPoolProfile["count"]))
        by cluster_name = name
| order by total_nodes desc
# Clusters and their corresponding Log Analytics workspace
resources
| where type contains "microsoft.containerservice/managedclusters"
| extend la_id = properties.addonProfiles.omsagent.config.logAnalyticsWorkspaceResourceID
| project name, Log_Anlytics_ID = split(la_id,"/")[8]
Cheers,
Sriram